
 The Hunger Stones stories making media rounds but not too much analysis on the subject except the Physics.org article. I found a PDF that goes back 1000 years in the Czech Lands with droughts and my conclusion is (a repeat of 1770's type drought) event happening now based on the last 1000 years of data and current water levels are lower than at any period on the Hunger Stones.
Ancient Hunger Stones the European Drought Cycle Clock
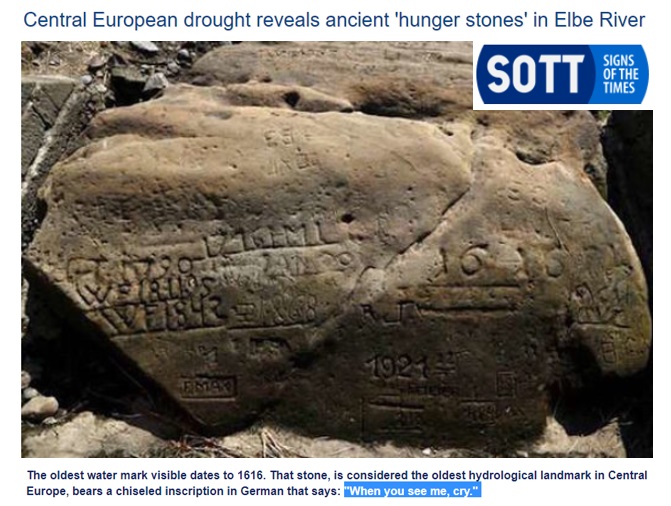
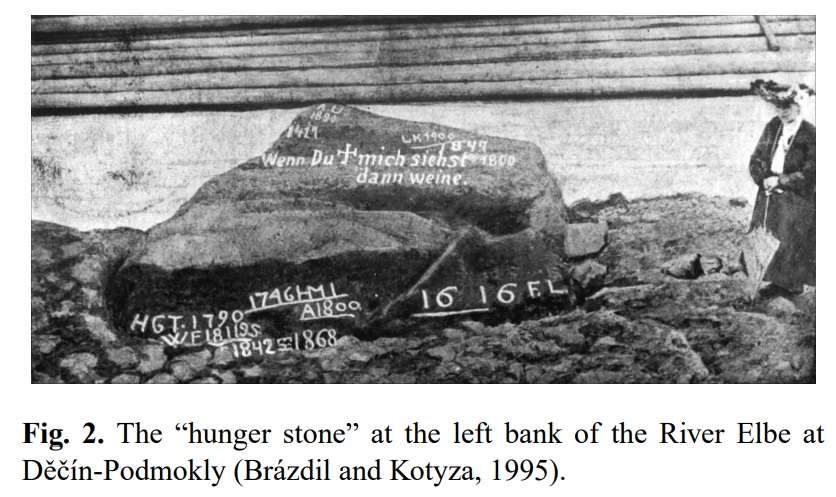
Let's talk about the Central European Hunger Stones. This is the Elbe River, the stone you see has been chiseled into when it gets to extreme drought levels in the river, and the inscription reads “When You See Me Cry”, because when this went below certain levels, crops were wiped out for years at a time.
You have to realize back in the Maunder Minimum, they didn't have a global delivery system as we do today, it was more local production, local consumption at that time. Let's take a look at some of the numbers, the years 1616, 1842, and 1921. Do you notice anything peculiar about this stone? The level we're at today is below everything else on this stone.

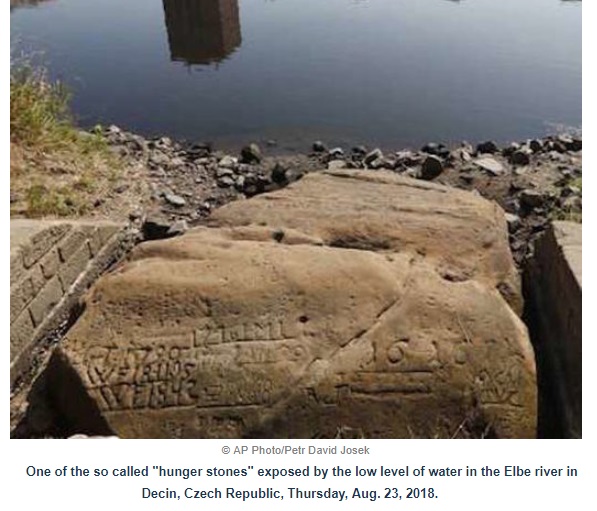
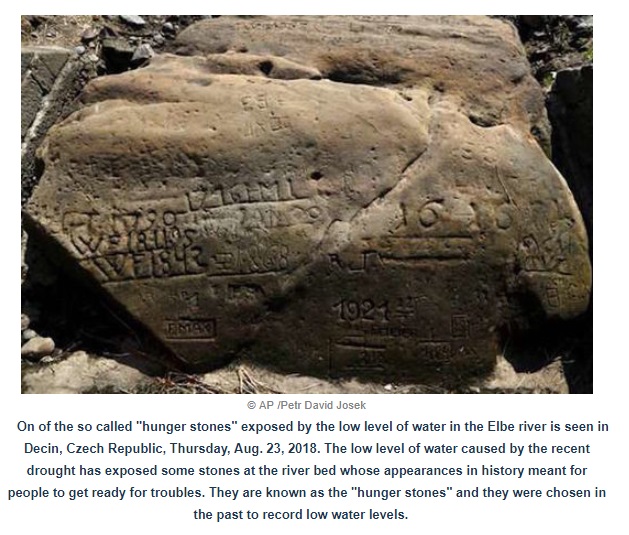
It's bone dry on the sand below the stone, even at the lowest marks in history and the most horrific droughts, we're eclipsing that right now. I thought to myself all right where is this stone how long has it been around there, Czech Republic, Elbe River.
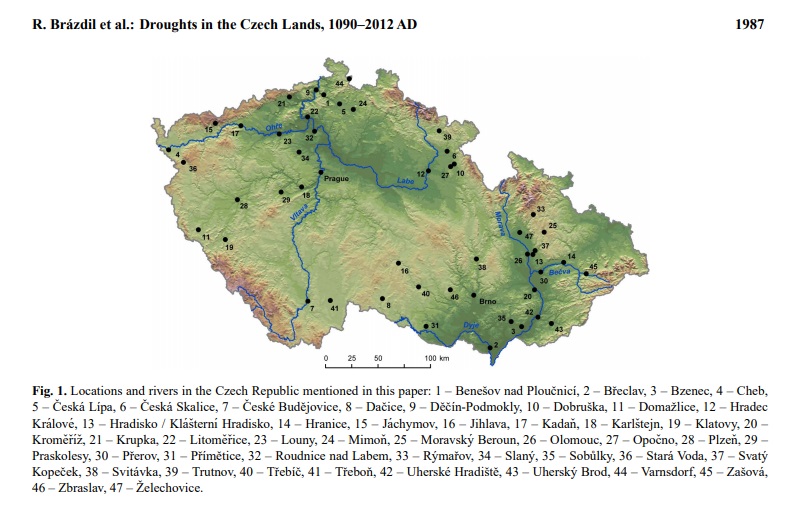
I started looking around through the Czech Republic, and I did a DuckDuckGo search about” hunger stones historical”, I started with that as my search and right away a PDF came up, drought in the Czech lands, 1098 AD to 2012. Oh, my. Was this a shocker to read? I spent more than an hour in this small PDF, the rivers that are running through the Czech lands at least at that time. You have to realize governments have changed borders since then.
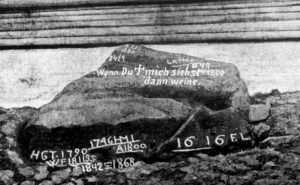
This is what the image looks like, that was referenced in the PDF. Notice the woman's dress on the right, this is far long ago when this image was taken but it was cataloged and put into this PDF in 1995. They even highlighted in white where the height of the water was during some of the major droughts, and you'll see this goes back to the 1860s ,1840s, 1811, 1790, and 1616.
It's all about the low water levels and we're way below that right now. Let's look back into the report and see what the droughts were like in Central Europe historically.
We can forecast out exactly what's going to happen right now based on the last centuries of records, more drought is on the way, and it’s going to be a significant drought that will reduce crop production across Europe. That's my own opinion, but after you see this information you may very well agree with the conclusion.
This is the drought severity index, but this only takes us back to 1805. The darker the bars that you see there, the more intense the drought was from April to September. When we get into the 2001 era you can start to see some of the same intensity through time 2001, 1941, 1841, 1831, that 1841 matches up with 1840 on the rock. Ok, that was an intense drought with crop losses at the time, but nothing in comparison because we had global delivery and water is being pumped from different locations as well, we have different delivery systems for our water that they just didn't have in the 1600s.
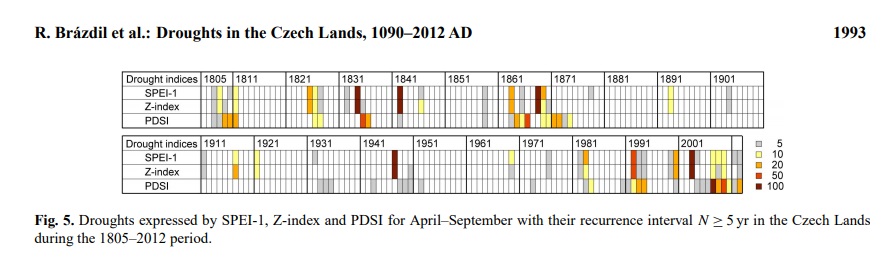
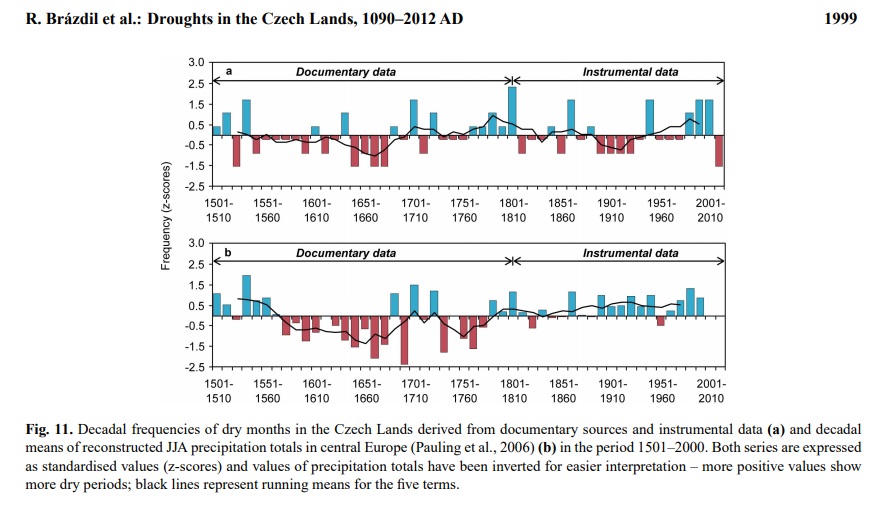
A look at significant droughts marked on that stone, when we drop back into the 1616 era, that's only approximately minus 30 in the intensity, it's really not that intense overall compared to what you're seeing in the 1700’s. Reading the report that most intense droughts were in the 1500s and the 1700s but was noticeable in this is the authors talk about the decadal frequency, because these droughts seem to be come in three to five years spurts if you will, it's not one year of bad drought and then nothing. It seems to be coupled in threes and fives, so three years and five years seems to be a set within these decadal frequencies.
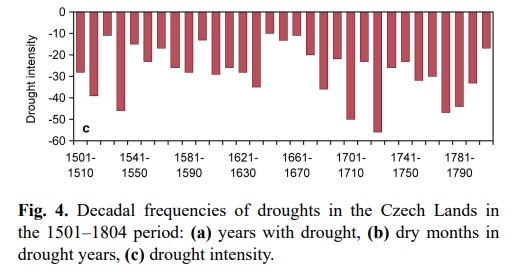
This is going to take us from 1500 up to (2010*), which they don't have the information for yet, but you can see it's in an extreme drought, It's going to fit somewhere on this chart here. I'll take you to look at what's in the stones, we saw those 1800 dates, and that does match with the above chart there. We can see some through the 1800s, mid 1900s, 1921 or so, and then we go back in 1600, at 1616 era does stick out, but once we get past at 1616 era there is a little bit of water. Suddenly it has that multi-decade drought, this is right in the Maunder Minimum intensification at 1640, was the official mark for the Maunder Minimum to onset, this is the term Little Ice Age as well. If we're going back into a Grand Solar Minimum right now, you would expect that we're going to repeat something and start to see significant droughts in these areas just as they did with their repeating 400-year cycle in the Sun and it seems to be on par.
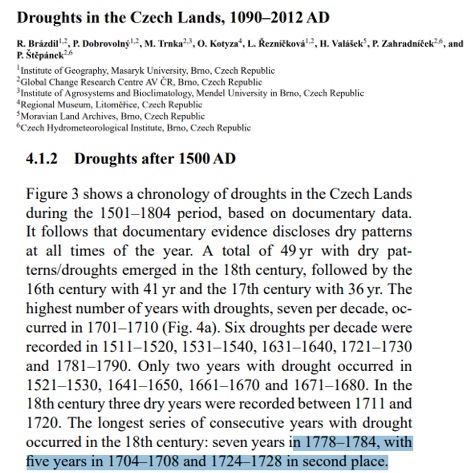
(ABOVE) Droughts after 1500 AD, this is same report droughts to the Czech lands last thousand years of time. They walk you through the different dates of drought and it seems the most significant dates were 1778-1784, that was coming out of the Maunder Minimum, and the significant dates of mid Maunder Minimum 1704-1708 match.
They've dissected the dry months here through each year January to December and there are another two sets above this, that take us back to 1000 AD. Since the water levels were lower than anything that has been at least in 1616, we can use that as a good benchmark for some of the lowest readings and then take a look where we are today. That 1780 era, you see how much drought was just year after year in different months going forward for five to eight years during that period. That's the lower bottom right where it says 1780, notice the bunching of drought months, above that you'll see it at 1680.
What you notice also if you see that 1616 date on the stone, and you go to the above chart, that long brown line right, then after the rainfall returned. Yet this time we are at a far more significant drought than that looking something in that 1780, 1774 to 1780 era, is what I believe we're into right now.
PDF of this Article Ancient Hunger Stones the European Drought Cycle Clock
FULL VIDEO Ancient Hunger Stones the European Drought Cycle Clock
Join ADAPT 2030 NEWSLETTER https://www.oilseedcrops.org
***Mini Ice Age Conversations Podcast***
- iTunes: https://itunes.apple.com/us/podcast/adapt2030
- Soundcloud: https://soundcloud.com/adapt-2030
- Libsyn: http://adapt2030.libsyn.com/
- BitChute: https://www.bitchute.com/hashtag/adapt2030
- Brighteon: https://www.brighteon.com/channel/adapt2030
- YouTube: https://www.youtube.com/user/MyanmarLiving
- Keep ADAPT 2030 independent: paypal.me/adapt2030
- Patreon: https://www.patreon.com/adapt2030
- Steemit: https://steemit.com/@adapt2030
- Medium: https://medium.com/@globalcooling
- FB: https://www.facebook.com/Miniiceage
- Twitter: https://twitter.com/adapt2030
- GAB: https://gab.ai/adapt2030
- Revolution Radio: Studio A – Thursday Nights – 10 PM to Midnight E.S.T. http://www.Freedomslips.com
- Content Created & Produced by David DuByne https://www.oilseedcrops.org