
 With all the talk of droughts and fires sweeping the Southern Hemisphere I found a connection to solar activity and drought cycles, which are with wildfire cycles. The connections between Southern Africa and Australia look as if its solar driven the changes. I will let you decide. Do you think this information is on the right track?
Southern Hemisphere Drought Connection: Southern Africa and Australia
This video was originally published 27/12/2019
At first glance, this headline would make you think of another massive Global Warming wildfire again, it is, but you have to realize, this was mostly started with an arson, coupled by high winds. The arsonists should be blamed for this incident; not climate change or CO2 levels.
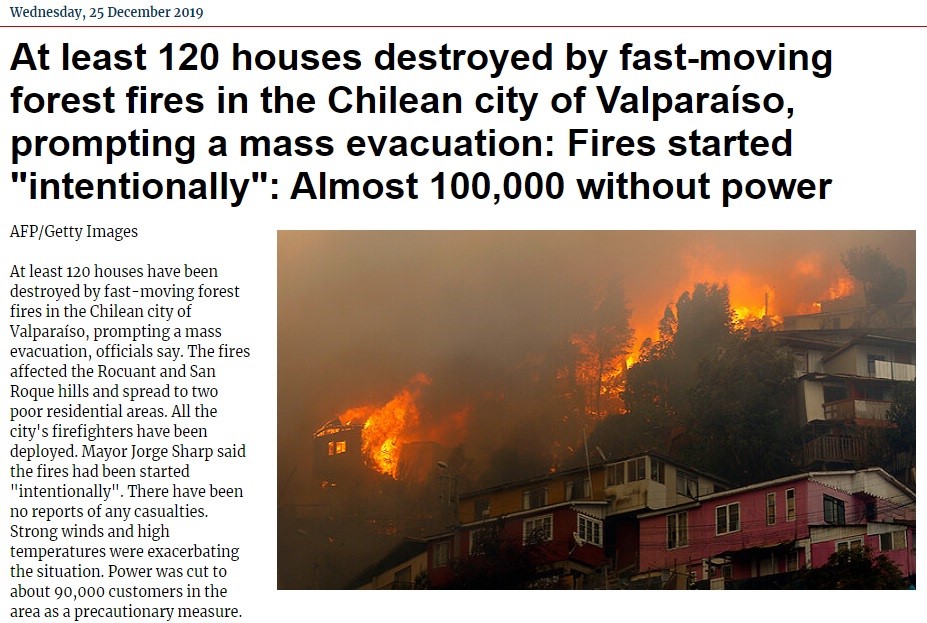
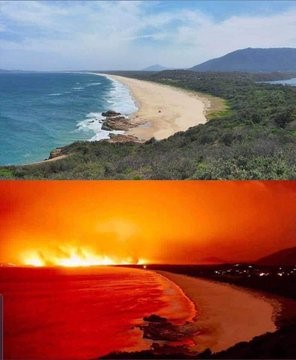
Conveniently, everything is blamed on climate change, but whatever the case is, these images captured off the beach prior and during the fires are impressive; scary in other word.
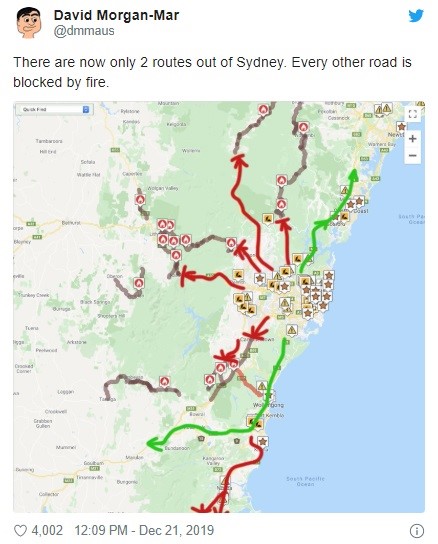
Meanwhile, these are the road closures coming out of Sydney during those fires. Only two exit routes were available, and this gives you option to either bug-in, but you better have some masks ready because even if it is not burning in the middle of the city, it will be very smoky; or you can also take your chances on the road with everybody else, but if you break down, you are going to have a more difficult time in your car trying to keep the smoke out, than you would have in your homes.
So you should be very careful about bugging-out in situations like these.
Curiously though, nobody seems to be talking about the cycles of drought through history in Australia. CO2 accumulations seem to be the ready-made alibi, which means the blame is on people, who are causing climate change.
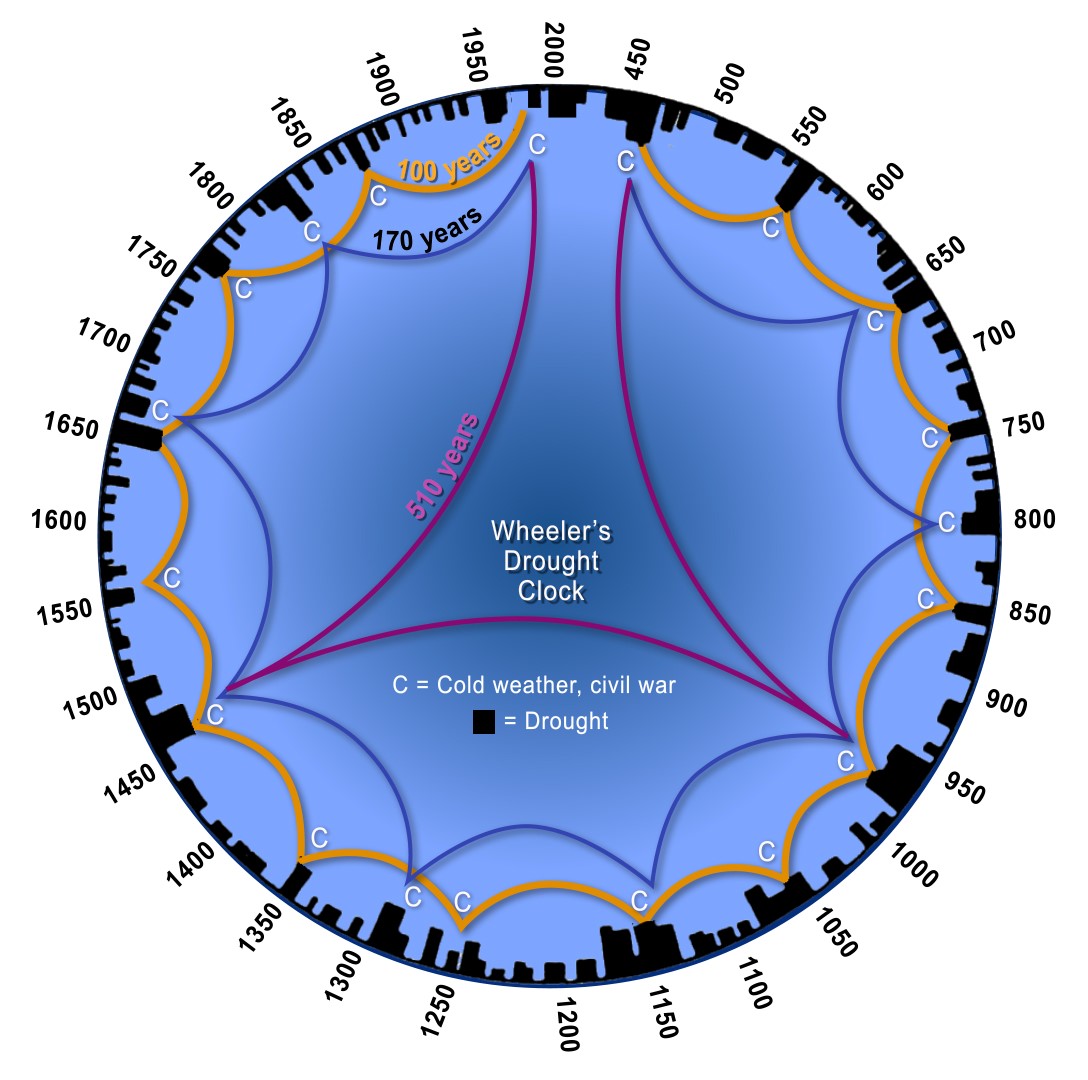
If you, however, consider to look back in over last 1,500 years, patterns in Wheeler’s Drought Clock are discernible on cycles.
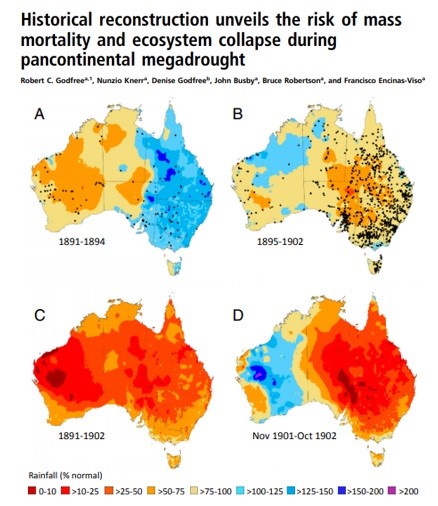
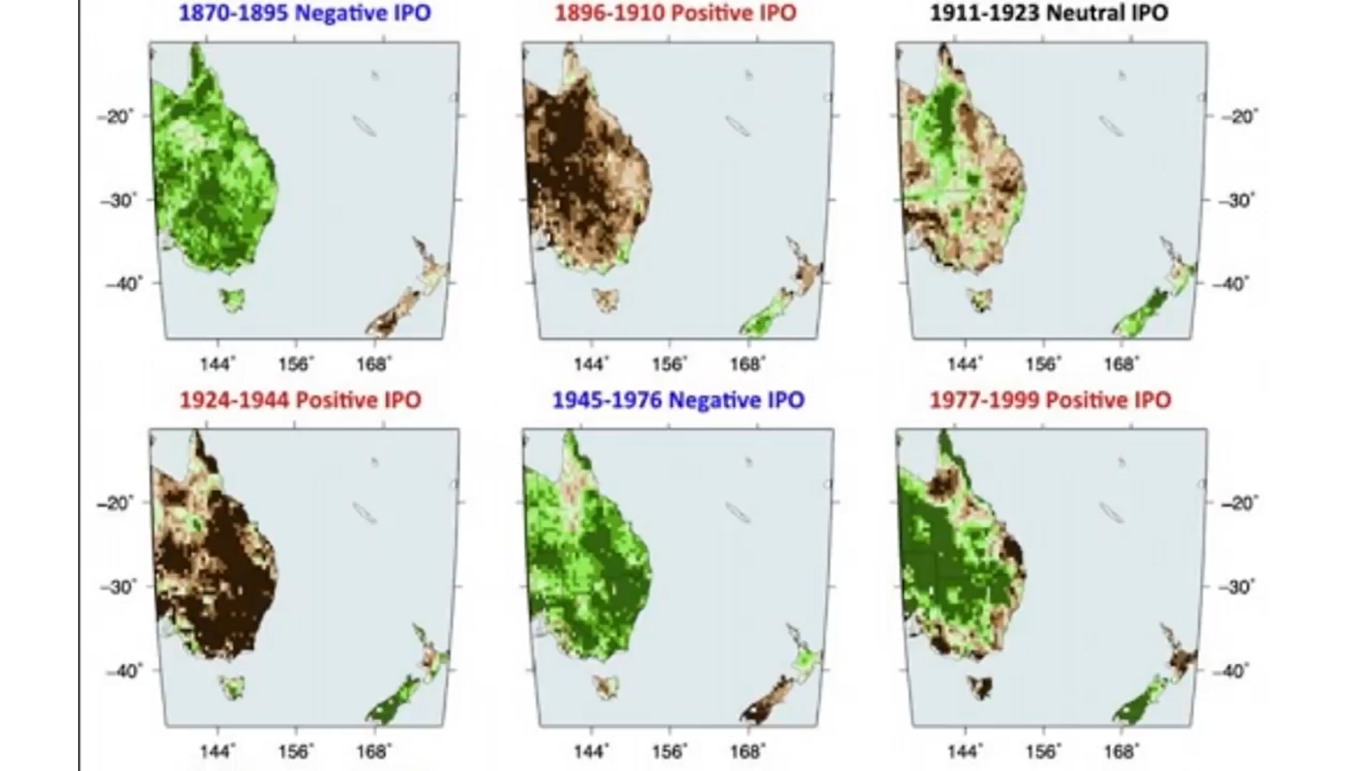
I am fascinated by the cyclic patterns of agriculture in Australia and was able to find this paper: “Historical reconstruction unveils the risk of mass mortality of ecosystem collapse during pancontinental mega-drought.”
As shown, the bottom left map are the 1891 and 1902 records, which is interesting because solar activity at the very moment matches back to the Centennial Minimum circa 1901.
Do you think there would be other matches through history? Not to forget, mega-droughts are being experienced again, with the same low solar activity. So, is there any correlation?
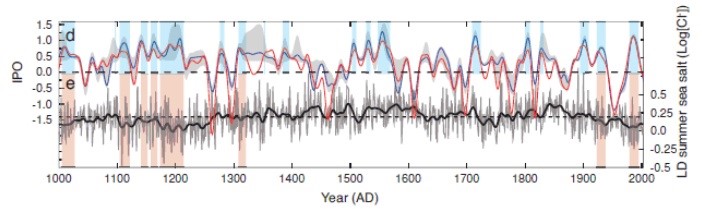
Anyway, atmospheric oscillations are the movement of cloud bands and cells in different places. This cause either more rainfall or more drought on a cycle on certain areas, and this has been mapped for the last 1,000 years.
Looking closer, whenever readings go above the 0.0 line, it is drought and when it’s below, it means wet. This, though, is off the chart a little bit to the right since we are in 2020, but is trending upward again. If you look at the peak, say circa 1999 to 2000, it is really high. We have to go all the way back to somewhere around 1550 to find something similar in drought intensity.
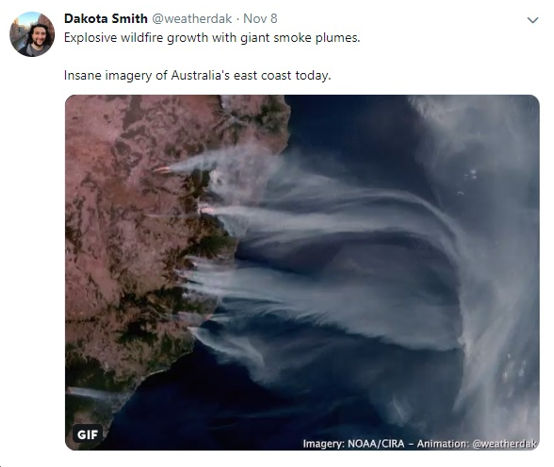
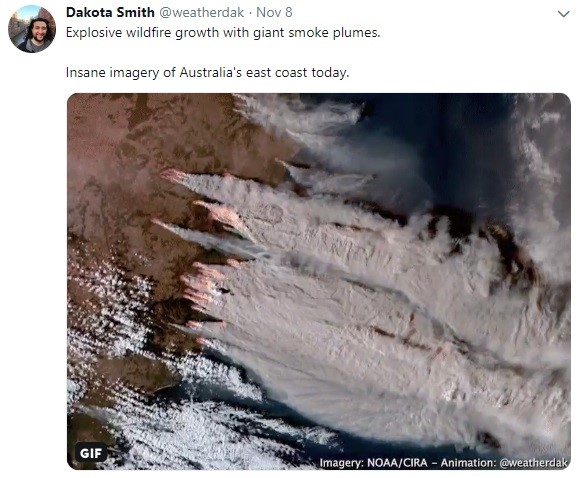
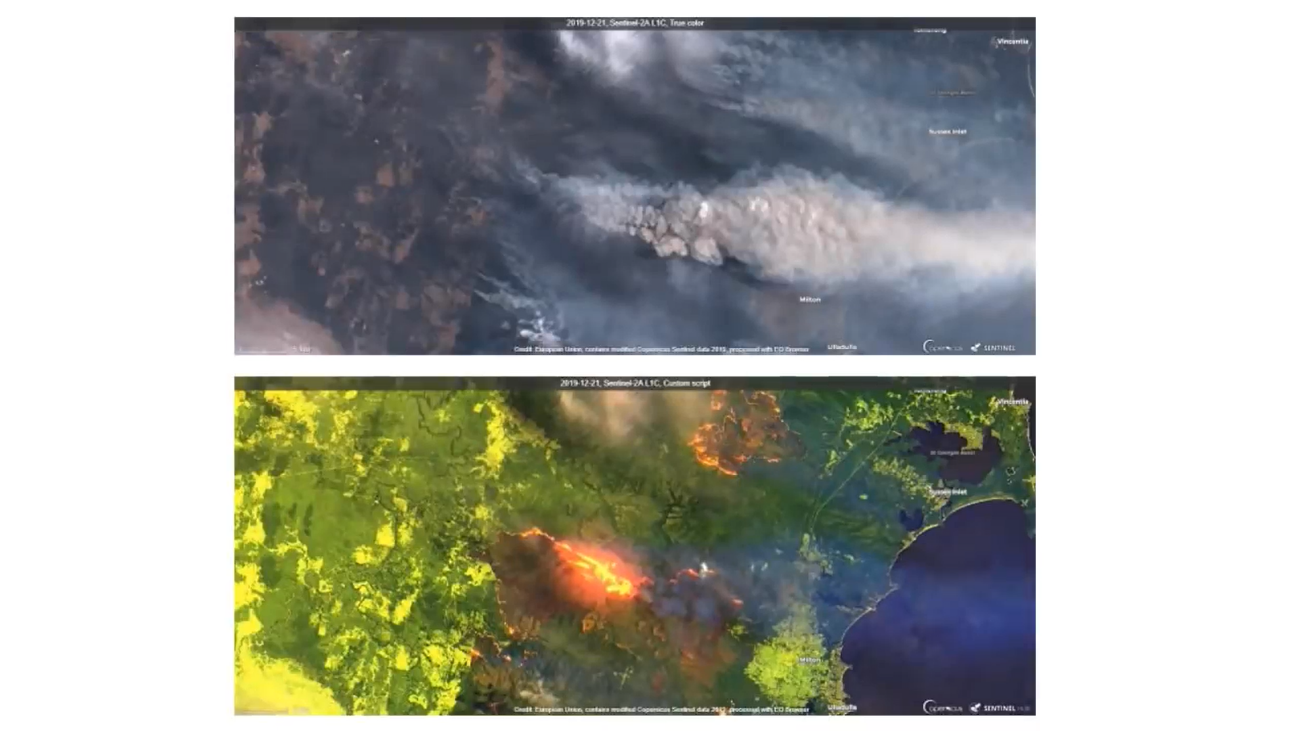
Going back to the recent wildfires, a lot of pictures show the smoke only, but what do the fires look like underneath the smoke? A different radar array penetrating through that thick smoke was used, and we are able to get a glimpse of the heat from the fires. It’s interesting to see how much fire it takes to create that much smoke.
These two images are exactly the same location, where the top image shows smoke and the bottom shows how large the fire is. Again, climate change has been said to have caused this.
Nobody is interested in looking at the Australia-New Zealand drought Atlas to find other causations. In the 1500s and over the last 500 years, you can see the same pattern. Thus, the same cyclic patterns of low solar activity and drought cycles in Australia are now revealing themselves.
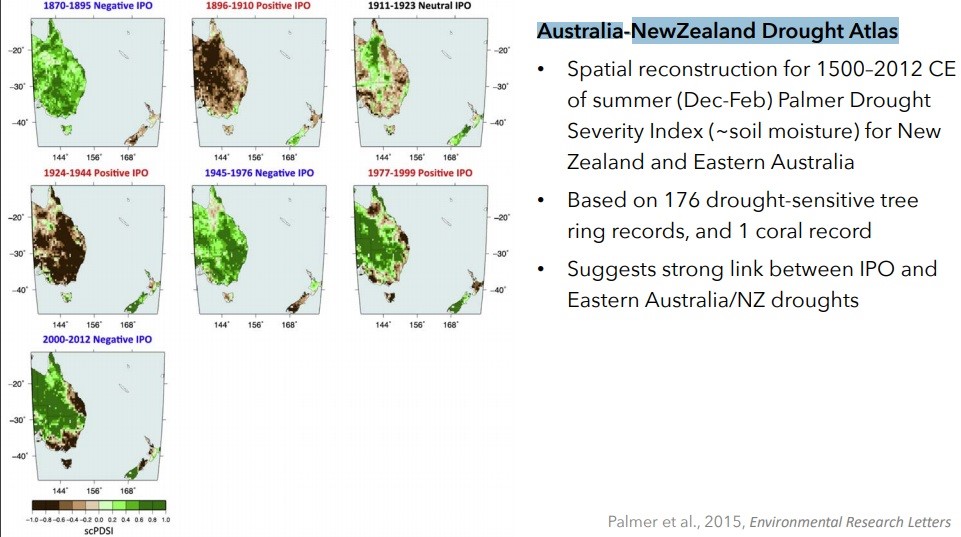
As a matter of fact, 1896 to 1910, the top middle chart, is exactly where we are with low solar activity in 2020, and back to 1901, we are getting the same droughts again. Yet no corporate journalists seemed to have seen this correlation. This is too inconvenient with the global warming narrative, trying to get a global CO2 tax passed.
Positive IPO means drought.
Another beautiful image of Finley Ridge. The huge contours are lovely from air, and it would be an incredibly fun day to just walk in that ridge.
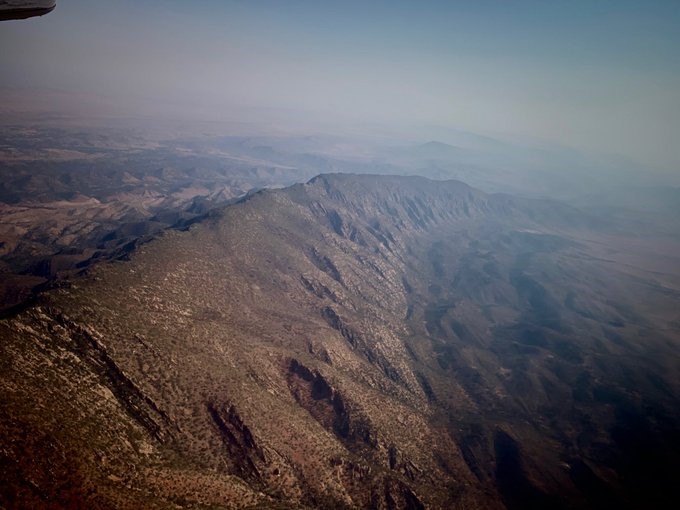
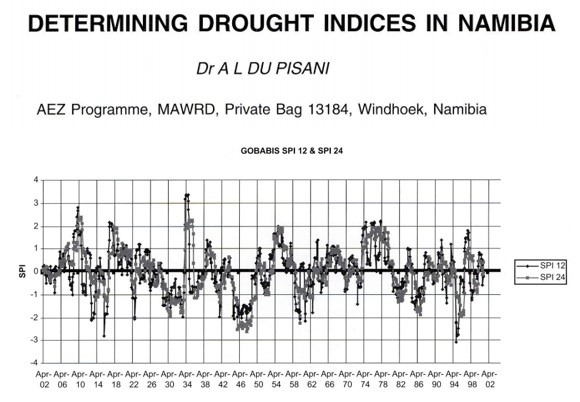
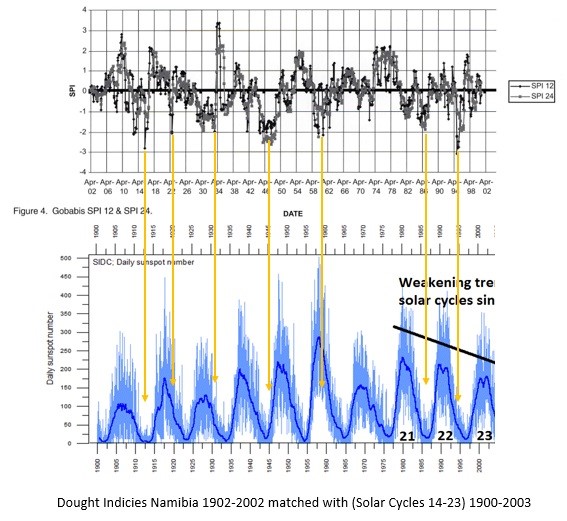
Finley Ridge, as well as Namibia are both in the Southern Hemisphere. What makes this interesting is, Namibia has record of its drought indices from about the same hundred, or so, years of time, taking us back to 1901 from modern record keeping. “Are these two countries run on the same oscillation and drought cycle? Because this graphic shows that the lower it goes below the zero point on the SPI, the more severe the drought becomes.
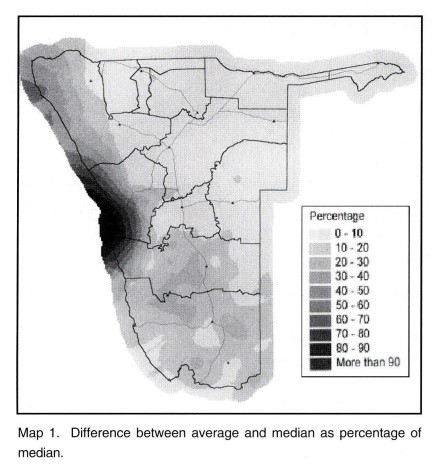
Additionally, analysis on where it is going to get wetter or when it is going to go back to drought over the last hundred years are already mapped out. From this, it can be deduced that the darker region will be the driest again when another cycle of drought comes in that country, and that should not be shocking, if you are paying attention to the importance of cycles.
I lined up solar activity from the turn of the last century. Follow the yellow arrows I placed on the chart. At the bottom of these droughts in Namibia, see where it sits on the solar cycle activity. Also, a lot is in the descent or the very bottom of the 11-year cycle.
Only one does not fit that pattern, while everything else shows that when it is sliding off or if it is in the solar cycle low, droughts happen. Interestingly, Namibia is back into drought again. So, there are now two continents with the same solar activity cycle that are both having droughts. Then again, just pay your CO2 taxes, and quit asking questions.
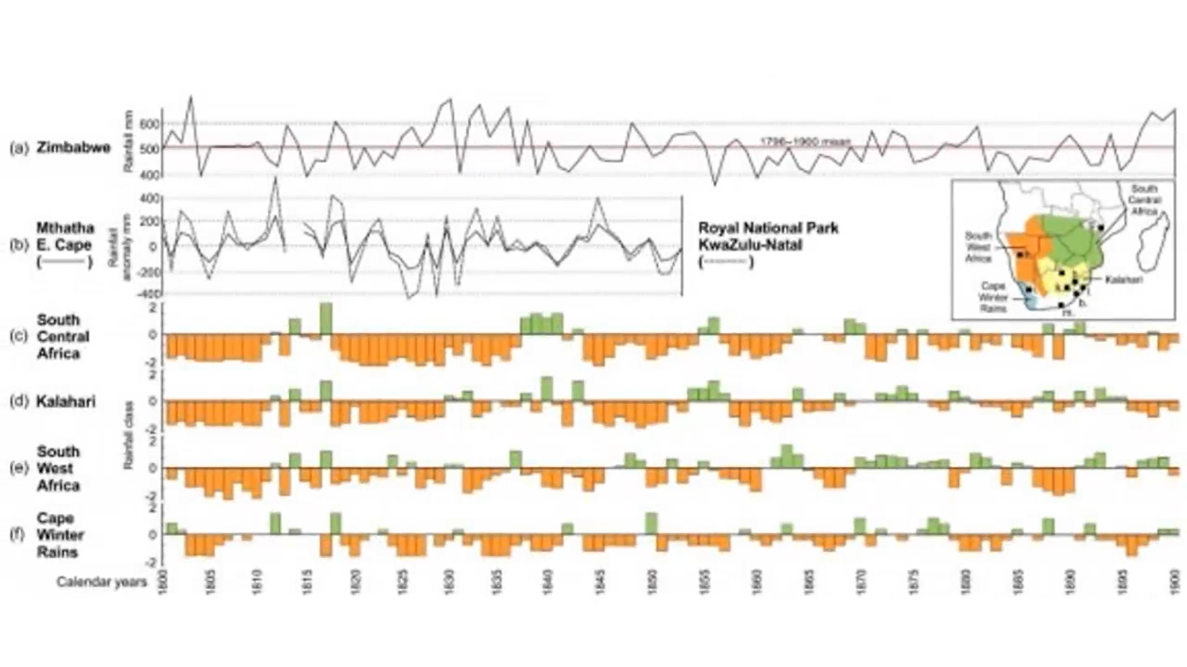
Moreover, these is a documentary and data of past droughts that is focused in Southern Africa. The arrow and the box I put in there are important markings. This chart goes back to the beginning of the last century, the year 1900. The box on the left should get much more intense drought based on solar activity, while the far right, where the arrow is, should have a little bit of downturn.
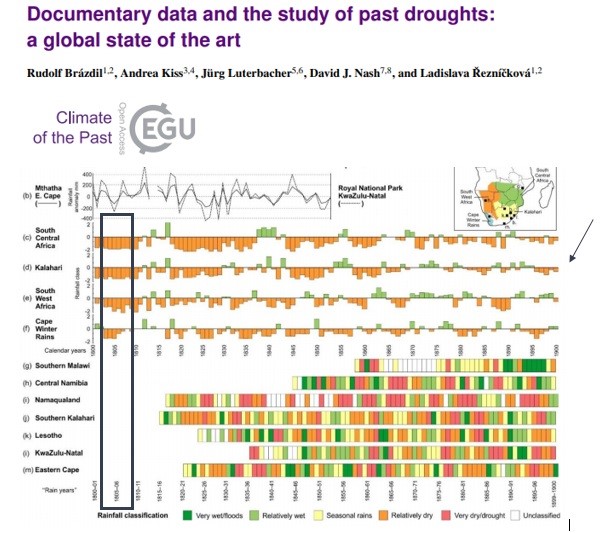
I enlarged the area of study for a better look, and the map on the right shows Southern Africa. They seem to have mapped a good indication of what would happen in different areas of Southern Africa, whether in the east, west, or south of southern Africa, during the drought cycles.
Far left shows solar activity, indicating that the next drought cycle is intensifying in southern Africa. Over on the right, in our present era, it looks like the amount of drought could double, or may have a little more in intensity in Southern Africa, as we move forward through the next few years.
To conclude, two continents will be on a drought cycle, based on the solar activity.
Thanks for reading, I hope you got something out of the article. If you like more content like this, I produce the tri-weekly Mini Ice Age Conversations podcast of a 30-minute in-depth analysis on the GSM you can take on the go through out your day.
PDF of this Article Southern Hemisphere Drought Connection: Southern Africa and Australia
FULL VIDEO Southern Hemisphere Drought Connection: Southern Africa and Australia
"Help support the adapt 2030 channel on brighteon so we can keep grand solar minimum information free to access."
Volcanism in the Mini Ice Age, Which Eruption will Drop Earth's Temperate Next (385)
https://www.brighteon.com/6010048504001
It's Not CO2. It's Not You, It's the Sun – ADAPT 2030 Limited Edition Design. Wearing this shirt may trigger Al Gore. https://teespring.com/stores/adapt-2030

***Mini Ice Age Conversations Podcast***
iTunes: https://itunes.apple.com/us/podcast/adapt2030
Soundcloud: https://soundcloud.com/adapt-2030
Libsyn: http://adapt2030.libsyn.com/
***Support ADAPT 2030 by Visiting Our Sponsors***
ADAPT 2030 & My Patriot Supply
Taking the Fear Out of Difficult Situations
2-Week Food Supply with 92 servings
True Leaf Market Organic & Heirloom Seeds
ADAPT 2030 True Leaf Market Link
ADAPT 2030 Amazon Grand Solar Minimum Book Store
https://www.amazon.com/shop/adapt2030
*** Today’s Story Links ***
Fire on Australian beaches
https://pbs.twimg.com/media/EMiXutFWkAEj1JE?format=jpg&name=360×360
Australia has had megadroughts for the last thousand years says ice core study
Historical reconstruction unveils the risk of mass mortality and ecosystem collapse during pancontinental megadrought
https://www.pnas.org/content/pnas/early/2019/07/09/1902046116.full.pdf
Australian fires in infared and visible
https://pbs.twimg.com/media/EMYkiEHWkAUAD06?format=jpg&name=small
https://pbs.twimg.com/media/EMYkiEPW4AEqvvD?format=jpg&name=small
Australian PM Responds To Greta Thunberg: "We'll Do What We Think Is Right For Australia"
Findlers Range
https://pbs.twimg.com/media/EMV50TiUcAAhkIZ?format=jpg&name=small
Snow patterns Iceland
https://pbs.twimg.com/media/ELeq4sEXYAAzFBn?format=jpg&name=small
What Really Happened In Iran?
https://www.zerohedge.com/geopolitical/escobar-what-really-happened-iran
Fast-moving forest fires in the Chilean city of Valparaíso, Fires started "intentionally": Almost 100,000 without power
http://www.thebigwobble.org/2019/12/at-least-120-houses-destroyed-by-fast.html
*** ADAPT 2030 Social Media Links ***
PATREON www.patreon.com/adapt2030
YOUTUBE ADAPT 2030 Mini Ice Age 2015–2035 Series on YouTube
BITCHUTE https://www.bitchute.com/hashtag/adapt2030/
BRIGHTEON https://www.brighteon.com/channel/adapt2030
STEEM https://steemit.com/@adapt2030
MINDS https://www.minds.com/ADAPT2030
MEDIUM https://medium.com/@globalcooling
FB https://www.facebook.com/Miniiceage
TWITTER https://twitter.com/adapt2030