
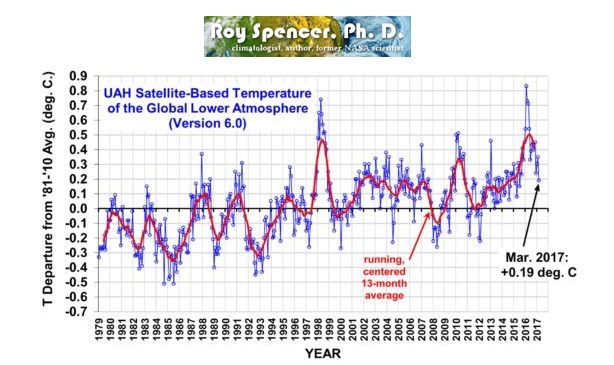
 NOAA releasing the new land and ocean temperature departure from March 2017. That temperature anomaly across North America looks pretty similar what happened to the monitor minimum so let's compare temperatures, I want to take you over to Dr. Roy Spencer's site here University of Huntsville Alabama (UAH) satellite March temperatures, down to 0.19 C, the Earth is cooling, but jump over to the NOAA report and they show skyrocketing temperatures. Let's just do the math and see how the numbers are being manipulated to show warming.
Showing Climate Lies in Global Temperatures & Greenland Ice Gain
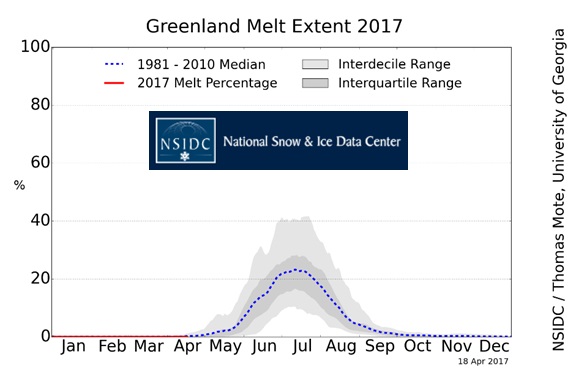
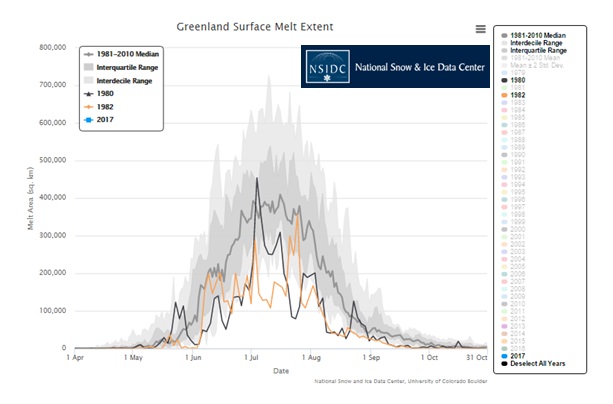
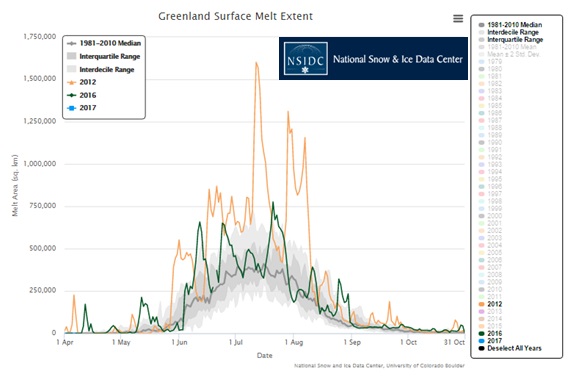
To clarify about Greenland ice loss and the very different numbers that DMI has compared to NASA the Greenland melt extent for 2017 hasn't even started yet that's how anomalous it is I was written several emails and comments on my board saying hey nsidc doesn't even count ice loss or melt until May well you know what that's totally incorrect you should do your own research here on the interactive charts before you start writing these types of things of course they count ice loss through April this is how anomalous it is.
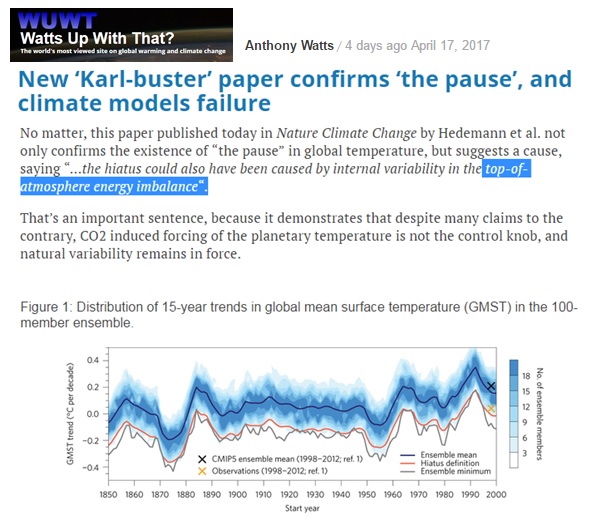
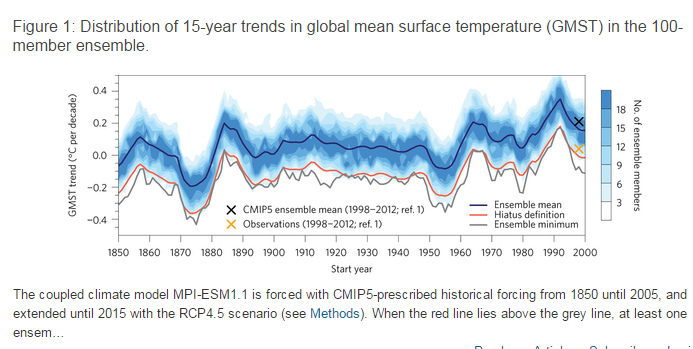
A new paper out the hiatus and global warming has been caused by what variability in the atmosphere energy imbalance oh that means no co2 warming the pause continues this is an amazing article I'll let you dig into it yourself. It's so in depth to explain but let me give it a try. Our upper atmosphere is the control knob of the temperature on the planet regulated by the Sun the magnetosphere and natural variability white out here for you the trend continues we are cooling.
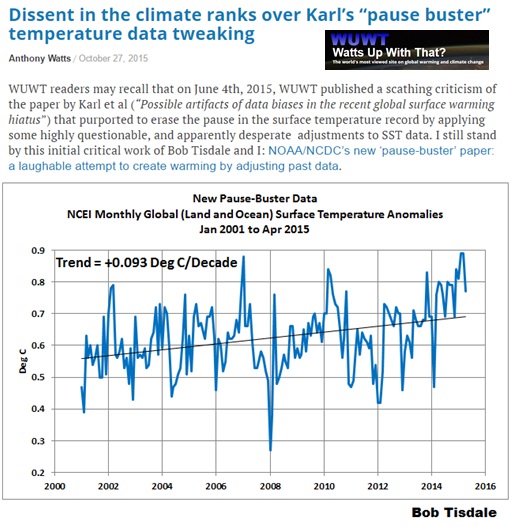
I do like what's up with that at the very bottom of the articles they have several other articles that are related to the topic and then this one caught my eye while I was at the comments section. Temperature data tweaking, that never happens in a political agenda does it?
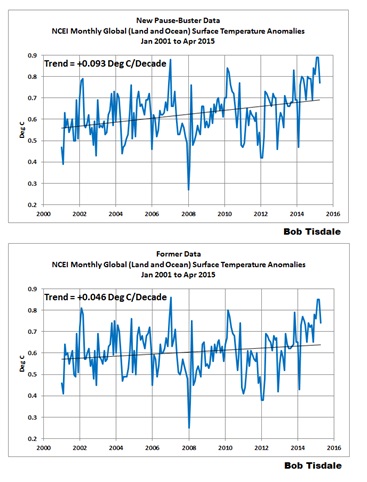
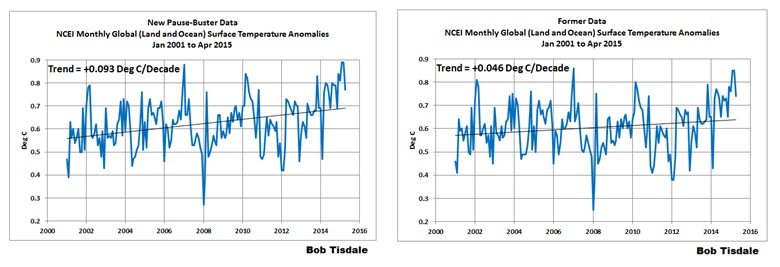
Let me put these top and top so you can really see before and after the former data set is on the bottom the adjusted set is at the top that's nearly double the one from point 0.46 C to 0.93 C. Here they are side by side if you look at it information differently. Thank you Bob Tisdale for putting this together, great job.
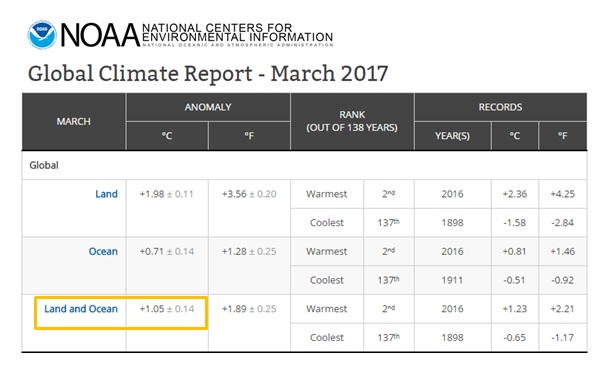
Staying on the theme of temperatures, NOAA releasing the new land and ocean temperature departure from March 2017. That temperature anomaly across North America looks pretty similar what happened to the monitor minimum so let's compare temperatures, I want to take you over to Dr. Roy Spencer's site here University of Huntsville Alabama (UAH) satellite March temperatures, 0.19 C, we are cooling. But jump over to the NOAA report, I've highlighted in blue here behind the record 2016 March by 0.18 C, let's just do the math.
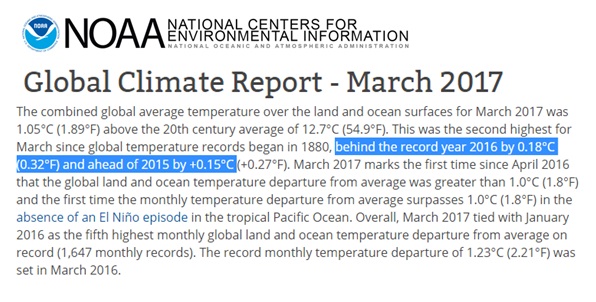
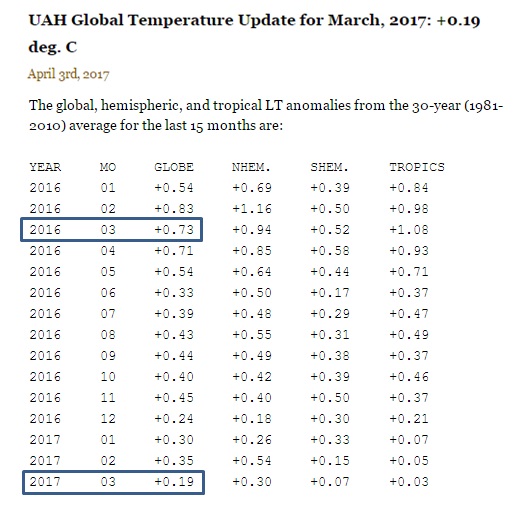
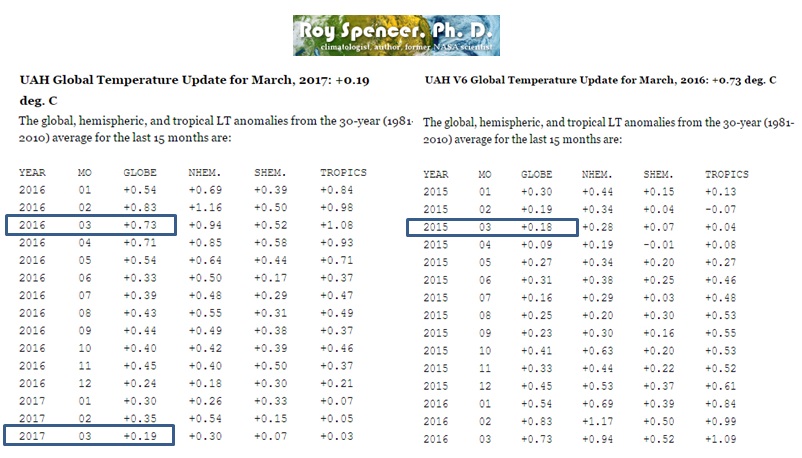
I dug up the data Dr. Roy Spencer puts all through his site you just have to go in there and look yourself. March 2016, top blue box point 0.73 C this year, 2017 March bottom. Do the math yourself, that is definitely not point 0.18 C. This cooled more than double what NOAA has put out and I know you're going to come back and say oh, it's a land plus the sea surface temperature, so these satellite temperatures don't matter. But the last 25 years all we've heard is the satellite record proves it, the satellites proved that global warming is happening, well now you can't have your cake and eat it too. You can’t now try to discredit satellite information at saying land-based and sea surface temps are even more correct than the satellites, which were the same satellites previously proving that global warming was real all these years. The lies need to stop now.
Continuing, ahead of 2015 by 0.15 C same month of March, so I dug in March 2015 0.18 C global temperature, let's subtract that 2017 bottom left point 0.19 C, so wait a second they just said it was ahead by 0.15 C, so for me 0.19 minus 0.18 equals 1/100th of a degree, and they are trying to report that it was ahead by 0.15 C, that's 15 times difference.
Let me present it to you in a different way, this is straight off the NOAA environmental center climate report, so they put global temperatures and divided them into land and ocean, then they have the total at the bottom. If you combine the two so it's a land- the ocean and then you get this total 1.05 C, are you kidding me the only possible way they could have gotten that is starting way back in the 1850s from when it was below baseline and tried to add it up, unbelievable really.
Back to the numbers again, satellite temperature data set University Huntsville Alabama (UAH) I'll bring into the northern hemisphere, land + ocean, now the land temperatures are in dispute anyway because these temperature stations have been moved into the cities next to airport landing runways there's so much controversy about the land temperatures rises anyway, about where the stations are placed. I linked below the Steven Goddard site where he has a rundown, so much information on the exact topic I'm talking about I encourage you to go there and look the even claiming that 100 percent of the warming over the last 10 years has been to temperature station movements into warmer heat Islands.
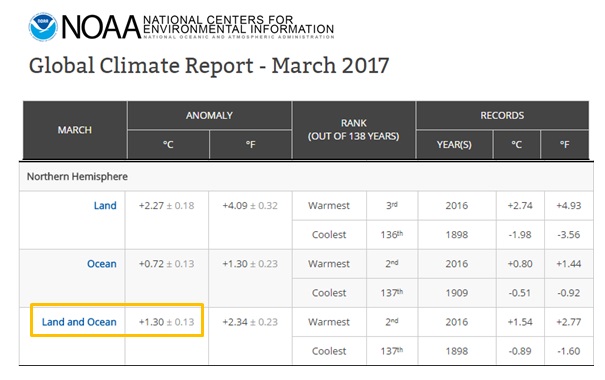
NOAA putting land and ocean on the northern hemisphere at 1.3 C now wait a second you just saw that entire North America was cooler than average how is that possible at the entire northern hemisphere warms, yet a substantial part of it was below normal temperatures.
Taking a look at this data set, here we have global and then there's the Northern Hemisphere and we'll bring it down it's right next to that blue box at the very bottom 0.3 C so that's a literally a whole one degrees C warmer temperature.
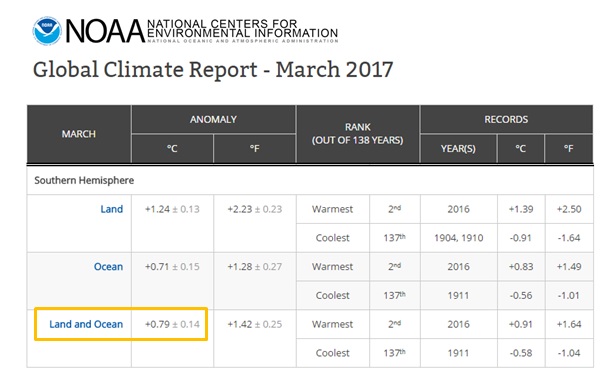
Southern Hemisphere, again they're broken it apart land + ocean to come up with 0.79 C but this column here in the southern hemisphere very bottom just before the tropics 0.07 C that's running seven tenths of a degree warmer.
So where is this political agenda coming from the planet is cooling, yet we keep getting fed these numbers that are absurdly warmer than what you're seeing with your eyes in 2017. It’s not going to be the warmest year ever this year, Europe is going to be below normal temperatures, here for April more cold fronts are sweeping down from Canada all across the United States right now.
I've linked everything below and I hope all of you do your own research and just try to verify what I'm talking about ask questions right to some of these people ask them to explain it and if you'd like to kind of information I'm giving to you here on this channel please support me
I do hope this information can help you make more informed wise decisions going forward our planet is absolutely going into an intense mini ice age you do need to prepare I just don't get it why the governments of our world are not telling us what's about to happen I'm trying to bring you this information so you can get you and your families.
New ‘Karl-buster’ paper confirms ‘the pause’, and climate models failure https://wattsupwiththat.com/2017/04/17/new-karl-buster-paper-confirms-the-pause-and-models-failure/
http://www.nature.com/nclimate/journal/vaop/ncurrent/full/nclimate3274.html
Dissent in the climate ranks over Karl’s “pause buster” temperature data tweaking https://wattsupwiththat.com/2015/10/27/dissent-in-the-climate-ranks-over-karls-pause-buster-temperature-data-tweaking/
Greenland Interactive Ice Chart http://nsidc.org/greenland-today/greenland-surface-melt-extent-interactive-chart/
UAH Global Temperature Update for March, 2017: +0.19 deg. C http://www.drroyspencer.com/2017/04/uah-global-temperature-update-for-march-2017-0-19-deg-c/
2015 March Data temperature set http://www.drroyspencer.com/2016/04/
NOAA March Climate Report https://www.ncdc.noaa.gov/sotc/global/201703
100% Of US Warming Is Due To NOAA Data Tampering https://realclimatescience.com/2016/12/100-of-us-warming-is-due-to-noaa-data-tampering/
Video and Content brought to you by David DuByne (ADAPT 2030 Mini Ice Age 2015-2035)